
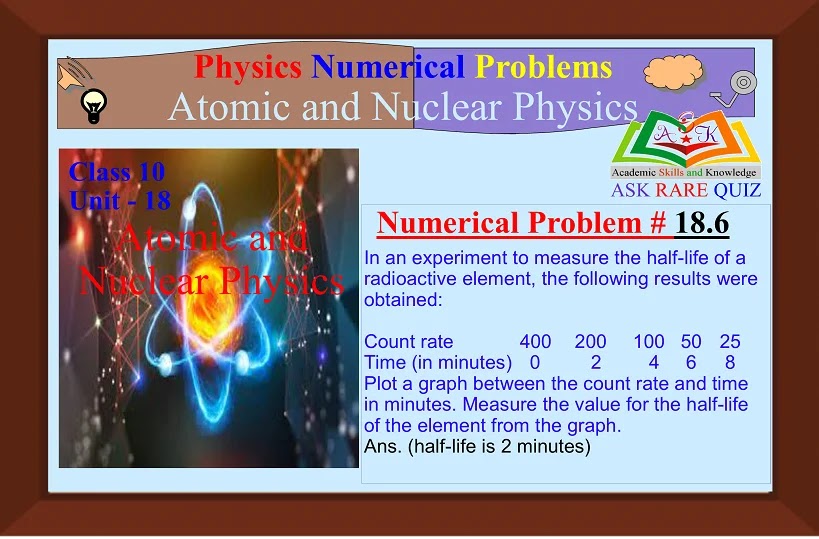
In an experiment to measure the half-life of a radioactive element, the following results were obtained:
Count rate (per minutes |
400 |
|
|
|
|
|
|
0 |
|
|
|
|
Plot a graph between the count rate and time in minutes. Measure the value for the half-life of the element from the graph. Ans. (half-life is 2 minutes)
Data Given:
| Count rate per minutes | 400 | ||||
0 |
To Find:
Solution:
Scale :
Along X-Axis: One big division = 2 minutes
Along y-Axis: One big division = 100 counts per minute
The required Graph according to the given data is below

************************************
Shortcut Links For
1. Website for School and College Level Physics 2. Website for School and College Level Mathematics 3. Website for Single National Curriculum Pakistan - All Subjects Notes
1. Website for School and College Level Physics
2. Website for School and College Level Mathematics
3. Website for Single National Curriculum Pakistan - All Subjects Notes
0 Comments
If you have any QUESTIONs or DOUBTS, Please! let me know in the comments box or by WhatsApp 03339719149