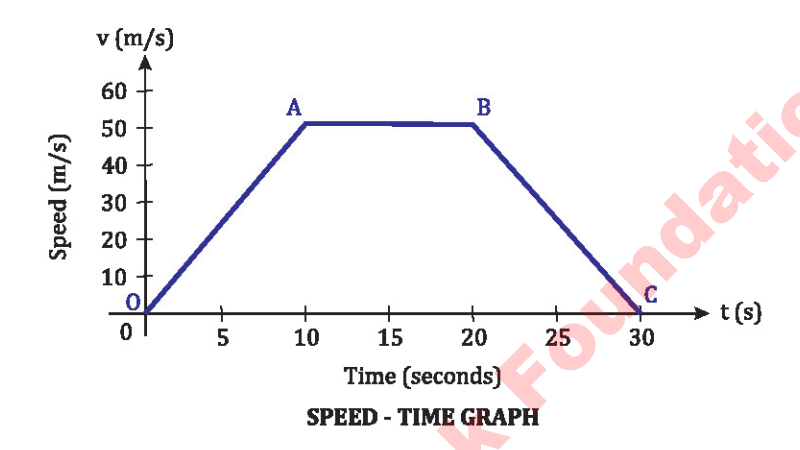
Consider the following speed time graph. Tell:
a. Which part of the graph is showing acceleration, deceleration, and zero acceleration?
b. Calculate the covered distance from 10 seconds to 20 seconds from the graph

Ans {Line OA, Line BC, Line AB, 500 m }
a. Which part of the graph is showing acceleration, deceleration, and zero acceleration?
Answer:
Acceleration = Line OA
Deceleration = Line BC
Zero Acceleration = Line AB
b. Calculate the covered distance from 10 seconds to 20 seconds from the graph
Given Data:
Time (from 10 to 20 s) = t = 10 s
Speed = v = 50 m/s
To Find:
Solution:
By using the equation
S = vave x t
by putting values
S = 50 m s⁻¹ + 10 s
S = 500 m ----------- Ans.
************************************
Shortcut Links For
1. Website for School and College Level Physics 2. Website for School and College Level Mathematics 3. Website for Single National Curriculum Pakistan - All Subjects Notes © 2020-21 Academic Skills and Knowledge (ASK) Note: Write me in the comments box below for any query and also Share this information with your class-fellows and friends. |

0 Comments
If you have any QUESTIONs or DOUBTS, Please! let me know in the comments box or by WhatsApp 03339719149